Moving Average Convergence Divergence (MACD)
The moving average convergence divergence indicator is commonly called the MACD. The MACD is designed to find up trends and down trends in a stock via its moving averages.
MACD

The MACD indicator is calculated using three attribute of the stock’s price movement. Those 3 attributes are usually shown as MACD (12, 26, 9).
- The first number (commonly 12) represents the number of days used to calculate the faster moving average or EMA(12).
- The second number (commonly 26) represents the number of days used to calculate the slower moving average or EMA(26).
- The third number (commonly 9) represents the number of days used to calculate the “trigger line” using EMA(9).
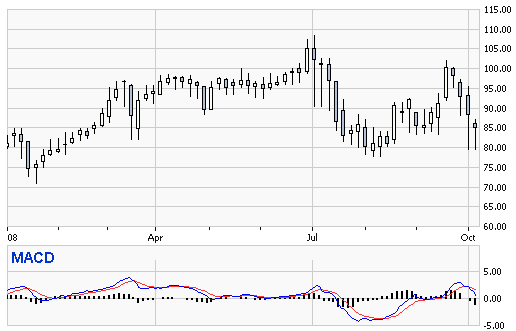
Now, we will explain the actual visual aspects of the MACD. Referring to the image above you should see.
- A blue line is calculated with the EMA using the first number of the MACD (commonly 12) minus the EMA using the second number (commonly 26). Therefore, EMA(12) – EMA(26).
- The red line (the MACD Signal Line or Trigger Line) is calculated using the EMA using the third number (commonly 9). Therefore, the EMA(9).
- The MACD Histogram is calculated (assuming MACD(12, 26, 9)) with the formula: ( EMA(12) – EMA(26) / EMA(9) ).
- The Zero Line: The dark horizontal line, referred to as the “zero line” or “center line” is where the first two moving averages of the MACD equal zero. Therefore, using MACD (12, 26, 9) that would be when: EMA(12) – EMA(26) = 0. A cross above the zero line is considered a bullish signal and a cross below the zero line is considered a bearish signal.
To explain more about reading the histogram, the MACD histogram is the difference between the faster red 9-day EMA “trigger line” versus the slower blue line. When the distance between the red line and blue line increase, you will see the histogram bars getting bigger. This shows the divergence or the amount the faster and slower EMAs are diverging. When the distance decreases between the red line and blue line or converges you see convergence. Now where have I heard those two terms before? Oh yeah! The MACD is the Moving Average Convergence Divergence indicator; how about that?

MACD Moving Average Crossover
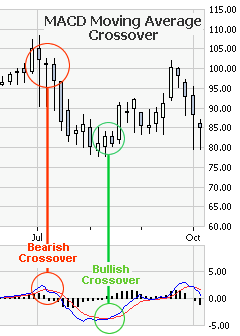
One of the signals most commonly used with the MACD indicator are the MA Crossovers. A Bullish MACD Moving Average Crossover occurs when the “slow line” of the MACD (shown above as the blue line) crosses above the “fast line” (shown above as the red line or 9-day EMA). A Bearish Moving Average Crossover occurs when the “slow line” of the MACD (shown above as the blue line) crosses below the “fast line” (shown above as the red line or 9-day EMA).
The image on the left shows you an example of a Bullish MACD Moving Average Crossover and a Bearish MACD Moving Average Crossover.
Its is very important to be careful with the MACD Moving Average Crossover, because while it is a popular one, it is also (on its own) a very unreliable one.

MACD Centerline Crossover
A MACD Centerline Crossover occurs when “slow line” (shown as the blue line above) of the MACD moves crossed the “center line” or “zero line”. If the cross over moves the “slow line” into positive territory (above the “zero line”) then this is a Bullish MACD Centerline Crossover. If the cross over moves the “slow line” into negative territory (below the “zero line”) then this is a Bearish MACD Centerline Crossover.
While the MACD can lag behind trends, being that the MACD is a moving average of moving averages, it is still one of the most popular indicators used by traders.