Double Bottom Pattern
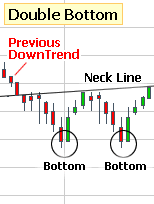
The Double Bottom Pattern is formed when a stock’s price falls to a support level once, bounces off and then falls right back down to the same support level. Therefore, usually within a short time span, a stock hit two lows of nearly the same price. The Double Bottom Pattern is considered a reversal pattern.

The above chart shows an example of a Double Bottom Pattern. You can see the two “bottoms” formed after the share price had a recent climb. By the stock hitting these two “bottoms” or valleys, it is confirming a strong support level. Therefore, it is likely that the stock will have great difficulty going any lower. Chances are it will stay above support and soon begin to climb back up
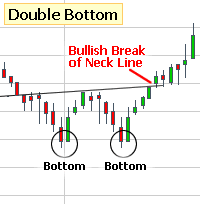
Should the chart break through its “neck line” there is a good chance for a bullish run. See the chart below for an example of this price trend.
