Double Top Pattern
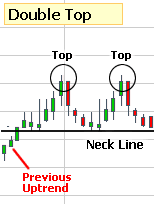
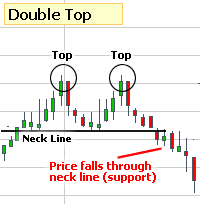
The Double Top Pattern is formed when a stock’s price climbs to a resistance level once, bounces off and then climbs right back the same resistance level. Therefore, usually within a short time span, a stock hit two highs of nearly the same price. The Double Top Pattern is considered a reversal pattern.

The above chart shows an example of a Double Top Pattern. You can see the two “tops” formed after the share price had a recent climb. By the stock hitting these two “tops” or peaks, it is confirming a strong resistant. Therefore, it is likely that the stock will have great difficulty going any higher. The direction it will likely go is down.
