Symmetrical Triangle
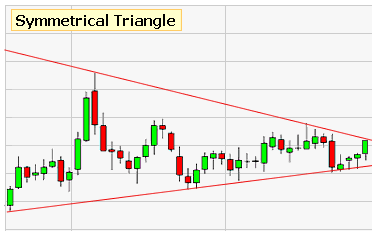
The Symmetrical Triangle chart pattern is formed when a stock’s highs and lows converge together to form a triangle shape. Therefore, the stock is having less and less price fluctuation. This is a stand off with the buyers and sellers. The Symmetrical Triangle pattern is considered a consolidation pattern.

As shown in the chart image above, a Symmetrical Triangle Pattern has formed. You can see the increasing inability for neither the buyers nor the sellers to control the price. When viewed with a candlestick chart you will also notice the candlesticks becoming shorter and shorter.
What Does the Symmetrical Triangle Pattern Signal?
Commonly, the Symmetrical Triangle Pattern is a strong signal of a pending breakout, meaning that eventually either the buyers or the sellers will win the battle. When the battle is finally won by the buyer then a bullish run is likely and when won by the sellers, a bearish price drop is likely.
Applying the Symmetrical Triangle Pattern
When planning an entry into a stock with the Symmetrical Triangle Pattern, a trader would place an order inline with a buy triggered from a breakout through the top line of the triangle and a sell triggered from a breakout below the bottom line of the triangle.
